Since next week is elections for various Federal and state offices, I was wondering what the voter turn-out rates were for older citizens and if they had changed over time. I first hit upon a summary of exit poll results from interviews of randomly selected voters as they exited voting places across the country on Tuesday, November 6, 2012 (1). This sample broke down into four groups: age 1-29 – 19%, age 30-44 – 27%, age 45-64 – 38% and 65 and over – 16%.
That number for the 65+ seemed to disconnect, so I found another source. This time a Pew Research summary of the Census Bureau’s voting report (2). It said, “The turnout rates of adults ages 65 and older rose to 71.9% in 2012 from 70.3% in 2008.” This seemed more in line with my expectations. See attached figure.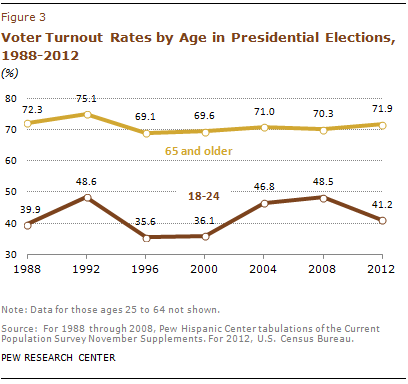
Another report from the Census Bureau shows that the 65+ group had the highest voter turn-out rate among all age categories. This has not always been the case. “The phenomenon of elderly Americans voting at higher rates than all other age groups is a fairly recent development in American elections. Between 1964 and 1992, voting rates for the 65 years and older group were either lower than or not statistically different from at least some other age breakdown” (3).
I then wondered about the exit poll survey that showed that the 65+ group were only 16% of those polled. Are the elderly simply grumpy people who won’t respond to survey takers’ requests upon exiting the polls? Maybe, but what about early voting and mail-in voting?
An older report (1994) from the Federal election administration provides some insight but because early voting and mail-in voting is managed by the states, the available data was rather limited (4). Texas actually provided fairly good data on a county-by-county basis and showed early voting rates between 47% to 24% in the largest counties. Mail-in ballots were lower, varying from 1.7% to 5.5% (p. 40). A report from the organization, Nonprofit VOTE, shows that early voting has expanded over the last twenty years (5). “National polls showed 33-40% of voters voted early in-person or by mail, up from 31% in 2008 and 23% in 2004” and “Older voters prefer to vote early, while younger voters prefer to vote in-person on Election Day. The same poll revealed that nearly half of voters 65 and over had either cast their votes in advance or were planning to, compared to a quarter of young voters aged 18-29.”
I used early voting this last Wednesday and it seems from the local news that early voting rates are way up this go around (6). Frankly as a techie person, I’m waiting for on-line voting myself.
References
- How Groups Voted in 2012. Roper Center for Public Opinion Research. Accessed at http://www.ropercenter.uconn.edu/elections/how_groups_voted/voted_12.html
- Paul Taylor, P. & and Mark Hugo Lopez, M. H. Six take-aways from the Census Bureau’s voting report. Pew Research Center. Accessed at http://www.pewresearch.org/fact-tank/2013/05/08/six-take-aways-from-the-census-bureaus-voting-report
- File, T. Young-Adult Voting: An Analysis of Presidential Elections, 1964–2012. U.S. Department of Commerce, Economics and Statistics Administration, U.S. Census Bureau, April 2014. http://www.census.gov/prod/2014pubs/p20-573.pdf
- Rosenfield, M. Early Voting. National Clearinghouse on Election Administration, Federal Election Commission, April 1994. http://www.eac.gov/assets/1/Page/Innovations%20in%20Election%20Administration%209.pdf
- America Goes to the Polls 2012. Nonprofit VOTE, Accessed at http://www.nonprofitvote.org/documents/2013/03/america-goes-to-the-polls-2012.pdf
- Roth, Z. After push to mobilize new voters, turnout surges in Texas. MSNBC, 10/22/14. http://www.msnbc.com/msnbc/after-push-mobilize-new-voters-turnout-surges-texas

Leave a comment